Methods
Analysis
This section will explain the various modules and parameters that were used throughout the analysis, including map compositions of each analysis.
I began with using the module initial as stated above. This allowed me to define the parameters of my project.
Pointras and polyras were both used to transform my vector files into manageable raster files.
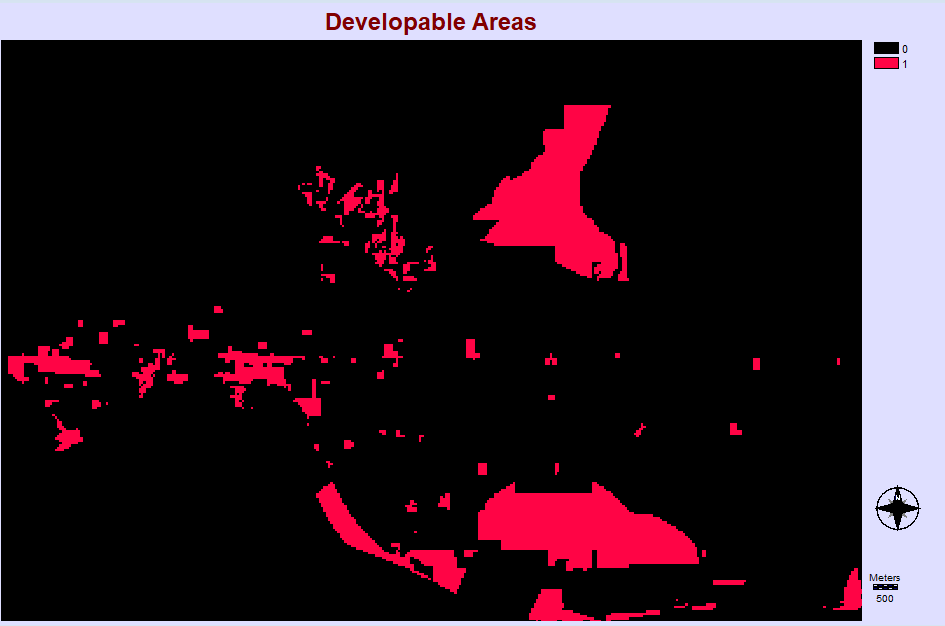
Reclass was used to reclassify my land use zones for both developable and non-developable areas. I first created areas that could absolutely not be developed on (water, parks, conservation areas, etc.) so I had a clear idea of where these areas were.
Overlay was used to create different files that consisted of the different reclassifications I created.
Then I created areas that were available for the development of a new brewery, that included commercial areas, industrial, open land, etc. The reason that both of these were identified was because they came from different shapefiles and I wanted to ensure accuracy.
As well, I also identified all of the residential areas in town to be used for further analysis using reclass.


Assign was used to identify all of the business licenses that were categorized as Food Services, meaning cafe, restaurants, coffee shops, fast food restaurants etc. This way I could work with the data that I wanted instead of dealing with any type of business found within the city.

Buffer was used to create a 76m buffer zone around street lights in the city. This was done because, according to the Vancouver Police Department (VPD), having a business in a well-lit area prevents burglary and robbery, especially late at night or overnight (Vancouver Police Department [VPD], n.d.) Being near street lights also ensures the safety of patrons as they are walking home after drinking as street lights help to prevent crime occurring out on the street as it provides for less areas for people to hide in the shadows and harm or rob others (VPD, n.d.). The distance of 76m was chosen because any further than this, and the area is no longer fully lit, only partially and therefore, the amount of crime can increase (jumping, robbing, etc.) (National Lighting Product Information Program, 2011).

Distance was used to create distance models from the Food Business Licenses, Transit Stops, Residential areas, and buffer of the Street Lights . This was so that I could use the fuzzy module to standardize the values and use them to conduct a Weighted Linear Combination analysis.


Then, I used fuzzy to create buffers that allowed for gradual decreases in suitable areas for street lights, transit stops, distance from residential areas and businesses with food licenses. The reasoning for each parameter is different and will be explained below.
For street lights, I kept the Boolean buffer on for analysis for safety reasons. This ensures that the most suitable locations will be within this area as it ensure the safety as explained above, which is something that I think about when leaving a drinking establishment (especially as a woman). I did a linear decrease from the buffer zone as this ensures that the area is well lit and therefore safer.

I used a linear function for transit as Jackson and Owens explain that locating a drinking establishment within 100m of a transit stop decreased the amount of DUI arrests drastically (2011). After 100m, people are less likely to use transit either to arrive or leave the location (Jackson and Owen, 2011).
The distance from residential areas was determined using a sigmoidal curve after 8000m. This was done because being near a residential area would decrease the risk of drinking and driving as people could be closer to home. As well, I did some research on how much an average family makes in Maple Ridge and found that 76.3% of the population makes under $50,000 a year (Statistics Canada, 2017). A study done right over the border in Washington found that people will spend up to 30% of their income on transit, which includes a car (Center for Neighborhood Technology, 2019). This would mean that many people in Maple Ridge could spend up to $15,000 a year (or less depending on total income as many were below $50,000) on transit. Cars are very expensive and could take up a large portion of this (insurance and gas alone- no maintenance can exceed $6000) (independent research). Then, I calculated how much it would cost to take a taxi in Maple Ridge and found that after 8km, it would be $20 (Numbeo, 2019). To many people, $20 can be a lot of money, especially considering income levels and other transportation costs. Therefore, I used this as the deciding factor in how far people may be willing to take a taxi and let the suitability decline after that.

Lastly, the distances for suitability near businesses holding a food licenses was determined with a sigmoidal function using 400m and 1000m as the control points. The reason proximity to food businesses is important is because all three of the breweries in town allow you to bring your own food in as many do not have their own kitchens or food licenses yet (independent research). Therefore, being near other food businesses in town would be advantageous to this brewery as it would allow people to get food and bring it there which would make them stay longer, instead of leaving to get food from somewhere else. The closer they are to these areas, the better. But this will not be a make a break for the business. The average walking distance that someone finds acceptable is 400 m, therefore areas within 400 metres of food businesses are most desirable and then after that it was noted that people will rarely walk over a kilometre, unless for exercise (Yang and Diez, 2012).

After completing these analyses, I then used weight to develop a set of relative weights for my factors so that I could complete an MCE. This provided me with adequate information to conduct my MCE which was done using the MCE function.

